You are here: Capture/Analyze > Packet Error Rate Statistics (PER Stats) > PER Stats - Pie Chart and Expanded Chart
Packet Error Rate - Pie Chart and Expanded Chart
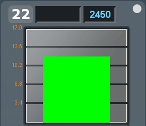
The Expanded PER Stats Chart (in the upper right ) displays detailed information about the channel selected from the main channel dialog.
| Expanded Chart | Pie Chart |

|

|
- When PER Stats is first opened, Channel 0 is displayed
in the expanded chart.
- The top orange number on the Y-Axis
displays the maximum number of packets in Snap Mode. If
Snap Mode is turned
off, the number will display in light blue. For information about Snap Mode, see "Packet Error Rate - Additional Statistics "
- The number of the selected channel is displayed
in the upper-left corner of the expanded chart.
- The combined value of Header and Payload/CRC
errors for the channel is displayed in red as a percentage to the right
of the channel number.
- The megahertz (MHz) value is displayed in light
blue text if the MHz
option is selected in the Additional Statistics section.
- The number of packets with no errors is displayed
in light green in the bar chart.
- All the values, except MHz, change dynamically
when multiple time periods are selected
in the "Packet Error Rate - Scroll Bar ".
-
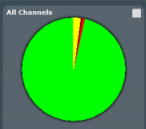
 When you select the
  in the upper-right
corner, the bar chart is replaced by a pie chart. The pie chart applies
to all channels, not a selected channel. To return to the bar chart, click on the channel again or click on the
  in the upper right hand corner.